Making the Chart That Best Illustrates My Current Music Listening Habits
Part 3 in a series recapping my Year In Music project for 2015

When I crack open a fresh data set, I like to get a sense of what is inside. Filtering, sorting, searching, and some simple charting familiarizes me with the data. Often, that process tips me off to the different stories I end up chasing through the data and then illustrating with numbers and visualizations. In the case of my favorite chart from 2015, it emerged from repetitive scrolling.
—
Discovery
As I moved up and down the spreadsheet, I began to notice consecutive rows where the artist field was the same. It stood out since I’ve always considered myself to be an album listener; put on the album and listen until it’s finished. I also noticed that there were similar streaks where the artist didn’t repeat. These, I assumed, were the playlist listens. In the current world of music, the album has given way to the playlist as the standard unit of listening. I felt there was something compelling to be shown if I could devise a way to visualize these two patterns and see just how album-centric my listening patterns really are.

Hand Sketching
It’s one thing to find a pattern, it’s something else to figure out how to clearly and concisely visualize it in a single graphic. One graphic I thought of for inspiration was Stefanie Posavec’s Sentence Drawings, where the length of each line is mapped to the length of a sentence and every time a new sentence begins, the line turns ninety degrees. I thought the idea could translate to my data set — every time the artist changed, something would change in the visualization. I also had in my mind that classic Joy Division album cover with the white wave forms.

Code Sketching
Moving from drawings to code tests the sketched out ideas and inevitably opens up new ideas. Processing makes the code sketching simple. It’s quick to setup, import data, and tweak parameters on the fly. The sketches start out very rough but are helpful to validate the idea with real data.


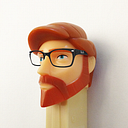
Refinement
Of the two options I explored, I felt the changing color bars worked more effectively to easily identify the patterns of album listening and playlist listening. To refine the idea, I separated out the bars by day and month, and added in some labels.

I still thought the oscillating lines would make for a more interesting graphic, but it was much harder to identify patterns at a glance.

Adding Complexity
I like to use my list of favorite albums of the year as a qualitative overlay on the graphics. Adding that layer of data on top of these charts added complexity so I focused on the more simple chart to test the inclusion of my favorite albums of the year.

Cracking It
While the colored bars were successful in showing the pattern, they were too noisy and didn’t have the right look. Aesthetically, the geometry of the oscillating lines was more beautiful. After some refinement, I found that condensing and heightening the oscillation got the right density and readability while maintaining a form that I liked. It also made the patterns of album listens and playlist listens stand out even more.

There was also a new listening pattern that I was able to see with this visualization, one I didn’t see in the data before. The new pattern is somewhere between an album and a playlist. It’s a grouping of 4–6 songs by the same artist, I call them “Selections”. They become much more prominent in the latter third of the year, which illustrates a change in listening that happens as the year goes on.

Now that I had a form for the data that illustrated the patterns in a handsome and effective way, I needed to find a way to overlay the chart with my top ten albums without compromising it. I found that dropping in the colored bars behind the lines did the trick.

Finishing Touches
With the chart complete, the final step involves adding in the bits that finish the chart and make it easier for the reader to decipher it on their own. These bits are labels and annotations — not too many, but just enough. Months and days, a few artists, and labels for the days with the most extreme listening — most consecutive songs by the same artist, by different artists, by top ten album artists.

Final Layout
Finally, the chart makes its way into the page layout of the book. It’s one piece of the larger story of my year in music tracking, but on its own, it is one of the most revealing charts. It gave me insight about how I listen to music that I might never have discovered otherwise. It’s this kind of graphic, and finding, that makes the effort and obsession of quantifying my music habits worth it.

—
Part 1, focused on the process of collecting the songs, can be found here. Part 2, highlighting my findings, can be found here.
—
There is a 12 page book summarizing my findings and process in tracking my year in music. It is a limited edition of 250 copies chocked full of data, maps, and visualizations. Order a copy of the book here.
Previous year’s projects are compiled on my website: www.ericboam.com